
Navigating the Futuristic Crossroads: Should We Keep Up the Momentum or Phase Out Future Developments in Oil & Gas?
By
Joel Bhagwandin
Summary
Any attempt to gradually phase out new developments will cause the momentum in the industry to be disrupted at the expense of slowing down economic activities in the broader economy and throughout the oil and gas value chain―only for supposedly higher short-term gains to the national treasury. The analysis herein demonstrates that with the continued rapid development to facilitate the ongoing approval of projects, the momentum in the economy can be maintained with minimal disruption in the economy―save and except those that may be attributed to other external, economic, political, and geopolitical factors that may arise while accruing over the longer-term, higher economic rent flowing into the national treasury.
Background
The author noted with interest the contentions proffered by the economic advisor to the Leader of the Opposition in phasing out future developments in the Stabroek block. This argument aims to maximize Guyana’s share of profit eventually.
Discussion and Analysis
It appears, however, that the aforesaid position was not informed by any analysis or proper study of how the industry works to understand the intricacies of the project lifecycle and/or, at minimum, an economic model of the Stabroek block.
The lifecycle of these projects includes three stages- exploration, development, and production spans- on average, 30-40 years. In the case of Guyana, for example, exploration before the discovery of oil in commercial quantities lasted fifteen (15) years, followed by the development stage, which spanned another five (5) years before moving into production. And according to the terms of the production license, this is another twenty (20) years to produce the resource. In other words, it took twenty years before a single barrel of crude oil was produced to generate revenue from the sale/monetization of the resource.
An elementary understanding of oil and gas decline curves is a prerequisite before engaging in any such discussion or debate. In this respect, in the petroleum economics literature, the decline curve basics state that when oil and gas are initially produced, it is known as primary production. Though a few exceptions exist, production from a strong water-drive reservoir may initially be flat. However, as oil or gas is produced, the water moves toward the well and eventually begins to be produced, at which time oil or gas production begins to decline. In cases where the production is limited to production facilities, the production is curtailed (CED engineering).
“As time passes, the reservoir pressure declines when the well can no longer produce at the curtailed rate, and production begins to decline. Water or other fluids (gas, CO2, etc.) may be injected into the reservoir to increase production and reserves in oil and gas wells. This is more common in oil reservoirs than gas reservoirs. Injecting fluids requires additional wells to be drilled or some existing producing wells to be converted to injection wells. The purpose of these injected fluids is to increase the reservoir pressure and push oil and gas to the production wells. If this occurs during or after primary production, this is known as secondary recovery. If some secondary recovery has already been done, it is known as tertiary recovery. The oil and gas production from secondary and tertiary recovery projects will typically increase until some point in time and then eventually decline as those injected fluids, along with oil and gas produced.” (CED engineering). Further, “regardless of whether a well is under primary, secondary, or tertiary production, it should be evident that production from wells will eventually decline. That being the case, this course will present information about methods used to forecast production decline. These methods are known as decline curve forecasts” (CED engineering).
With the aforementioned in mind, it, therefore, follows that any attempt to gradually phase out new developments will cause the momentum in the industry to be disrupted at the expense of slowing down economic activities in the broader economy and throughout the oil and gas value chain―only for supposedly higher short-term gains to the national treasury. Alternatively, by ramping up production, inter alia, encouraging ongoing exploration and development of the resource at a rapid pace, over the longer term, higher economic rent is more likely to be accrued in the form of the Government’s share of profit oil, all things being equal.
For illustration purposes, the undersigned ran some quick calculations considering the following assumptions:
- In scenario one, oil is produced at the current rate of production of 350,000 bbls/d, and all other developments are halted,
- In scenario two, oil is produced at 1,000,000 bbls/d from ten FPSOs
- The average price of US$75,
- Payback period of 5 years,
- Profit oil during cost recovery at 12.5%, and profit oil post cost recovery at 30%,
- The production life of the projects is 20 years, and
- The first fifteen years of production is flat before declining in the outer years towards the end at 25% per annum―thereafter.
The findings demonstrated that in the first scenario―Guyana’s cumulative profit oil will amount to US$54 billion over the 20 years period. Conversely, in the second scenario, as described above, the cumulative profit of oil over the 20 years period will amount to US$80.3 billion.
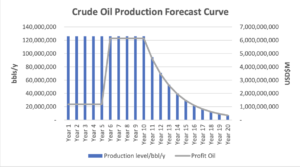
Scenario one: Author’s Calculation
The second scenario demonstrates that with the continued rapid development to facilitate the ongoing approval of projects, the momentum in the economy can be maintained with minimal disruption in the economy save and except those that would be attributed to other external, economic, political, and geopolitical factors that may arise.
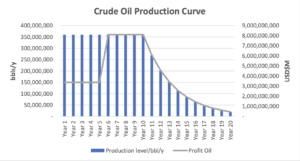
Scenario Two: Author’s Calculation
Finally, it is left now up to the readers/Guyanese to determine―in view of the foregoing background―which of the two scenarios is the better or preferred alternative for the country, given the country’s development needs and the aggressive pursuit of creating sustainable and increasing prosperity for the country and its people.
About the Author
Joel Bhagwandin is a financial and public policy analyst. He is also an entrepreneur with over fifteen years of experience in the financial sector; corporate finance; financial management; consulting, and academia. He has provided insights and analyses on various public policy, economic, and finance issues in Guyana for the past 6+ years. He has authored more than 300 articles covering a variety of thematic areas. Joel has also written extensively on the oil and gas sector. Joel holds an MSc in business management with a specialism in banking and finance from Edinburgh Napier University. He is currently pursuing his second and third masters: 1) MBA (Finance) (Top-up) through Edinburgh Napier University, and 2) MSc. in Finance (Economic Policy) through the University of London.
References:
__________
- https://www.cedengineering.com/userfiles/Forecasting%20Oil%20and%20Gas%20Using%20Decline%20Curves.pdf.
- https://www.eia.gov/analysis/drilling/curve_analysis/.
- https://www.guyanastandard.com/2023/04/06/govt-s-plans-to-fast-track-oil-industry-for-15-years-reckless-opposition/.