
The Sunday Essay · Public Opinion
Twenty Years of Listening
What Guyanese Have Been Telling the Pollsters
A first instalment in a GBJ polling initiative, and the case for building it on an established regional survey programme that has been listening to Guyanese since 2006.
By Terrence Richard Blackman, Ph.D. · Sunday, October 25, 2026
In This Piece
- I. The record: seven rounds, a repeated core
- II. The system and the idea: two curves that part company
- III. The institutions: the least trusted police in the region, and a decade of fewer bribes
- IV. The economy, the streets and the exit door
- V. What the record cannot tell us
- VI. What the Guyana Business Journal proposes
- Note on sources and method
Brooklyn, New York. In 2006 a team of social scientists at Vanderbilt University began sending interviewers to Guyanese doorsteps, on the coast, in Linden and in the hinterland, with a documented core of questions meant to be repeated: whether the courts can be trusted, whether a policeman has asked for a bribe, whether one is better off than a year ago, whether democracy is worth the trouble. The AmericasBarometer, run by the Latin American Public Opinion Project (LAPOP) and now housed in Vanderbilt’s Center for Global Democracy, fielded national face-to-face surveys in Guyana in 2006, 2009, 2010, 2012, 2014 and 2016, and a mobile-phone survey in 2021: about thirteen thousand interviews in all. LAPOP makes the released country datasets and reports available for free download.
The findings have received intermittent attention in Guyana: a Stabroek News report when the 2014 results were presented, a 2019 Business Page analysis of voting intentions drawn from the 2016 data, an editorial in 2022. Each surfaced, and each sank back into a database in Nashville. We argue about what “the Guyanese people” think on the strength of talk radio, Facebook threads and whichever party’s rally drew the larger crowd, while a series of national surveys beginning in 2006 waits for sustained public reading.
This essay reads it. It is the first instalment of a Guyana Business Journal polling initiative, and it begins where any serious measurement must: with the baseline. A mathematician would call what follows an existence proof. A time series of Guyanese public opinion exists. It has a shape. The shape raises questions about the years before oil that we need to put precisely before we can answer them for the years after it.
Three questions organise what follows. What has the AmericasBarometer actually found in Guyana? What does the record not tell us? And what should a Guyanese polling effort build on it?
I. The record: seven rounds, a repeated core
The value of the AmericasBarometer is not any single number. It is that across seven rounds LAPOP repeated a documented core of questions intended to support comparison, alongside modules that changed. Questionnaires, response options, eligibility and sampling designs did shift between rounds, so exact wording should be checked against each wave’s questionnaire before any two figures are set side by side. The 2006 survey was conducted by the Institute of Development Studies at the University of Guyana with Vanderbilt and funded by USAID; LAPOP’s records identify Development Policy and Management Consultants in Georgetown as the fieldwork firm for 2010, 2012, 2014 and 2016 (the 2009 note does not name a local contractor); the 2021 fieldwork was conducted by The Consultancy Group. The sampling geography is set out in the table and the note on sources. Confidence intervals must be calculated separately for each estimate from the survey design; the charts below show weighted point estimates only, and nothing is inferred from their visual separation.
| Round | Fieldwork | Sample | Mode and field partner | Notes |
|---|---|---|---|---|
| 2006 | 2006 | 1,555 | Face-to-face; IDS, University of Guyana, with Vanderbilt | Five geographic groupings; residents of Regions 7 and 8 excluded (technical note, dataset) |
| 2008/09 | Mar–Apr 2009 | 2,514 | Face-to-face; local contractor not named in the technical note | Seven geographic strata; largest face-to-face sample listed (technical note) |
| 2010 | Jan–Feb 2010 | 1,540 | Face-to-face; DPMC | Seven geographic strata; book-length country report (technical note) |
| 2012 | Jan–Feb 2012 | 1,529 | Face-to-face; DPMC | New design from this round: four geographic strata, sub-stratified by municipality size and urban or rural area |
| 2014 | 4 Jun–12 Jul 2014 | 1,558 | Face-to-face; DPMC | Results presented at the Georgetown Club, March 2015 (results deck, dataset) |
| 2016 | 17 Feb–23 Mar 2016 | 1,576 | Face-to-face; DPMC | Last pre-oil, pre-2020 round (technical note, preliminary report) |
| 2021 | 18 May–30 Jun 2021 | 3,011 | Mobile-phone CATI; The Consultancy Group | Random-digit dialling; voting-age citizens and permanent residents with a working mobile phone; split-sample questionnaire, so many items have a fraction of the total N (technical report, questionnaire) |
Two cautions. Because the 2021 survey used mobile-phone interviewing and so excluded adults without working mobile access, its estimates should not be read as directly interchangeable with the earlier face-to-face series; repeated items need mode-aware, design-adjusted interpretation. And Guyana was not included in the published 2023 round or in the 2026 round. The Guyanese record therefore stops in 2021, a year after the five-month election dispute and eighteen months after commercial oil production began. That gap is the first thing a GBJ initiative should close.
What the rounds share is a core of measures: the most serious problem facing the country; crime victimisation and neighbourhood insecurity; retrospective evaluations of the national and personal economic situation; a battery of bribery experiences; a five-item index of support for the political system; a four-item index of political tolerance; agreement that democracy is the least-bad form of government; and trust in institutions, the police above all. The 2016 preliminary report charts most of these from 2006 to 2016. Those charts are the spine of what follows.
II. The system and the idea: two curves that part company
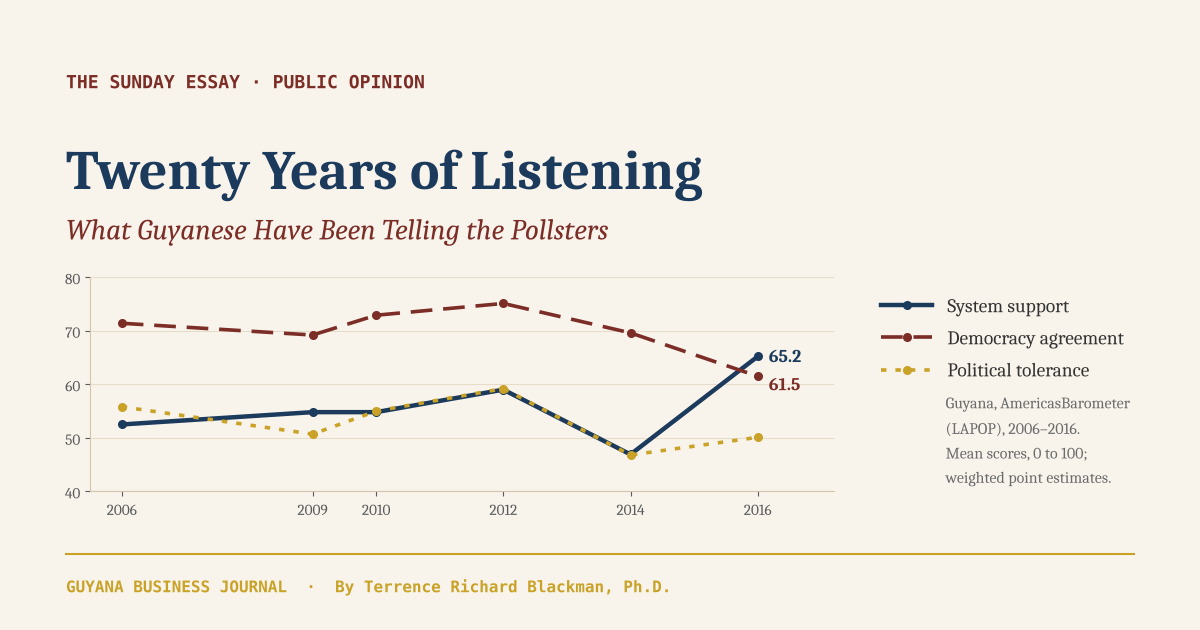
The most arresting pattern in the Guyana record is a divergence. Within the 2006 to 2016 series, the 2016 survey recorded the highest point estimate for support for the political system and, in the same interviews, the lowest for agreement that democracy is the best form of government.
Source: LAPOP, Preliminary Analysis of the 2016 Guyana AmericasBarometer (Donoso, May 2016), Guyana 2006 to 2016. Measures: system-support index, democracy-agreement item (ING4), political-tolerance index, each recoded 0 to 100. Weighted point estimates; record language refers to the observed 2006 to 2016 series only.
These are different constructs and the essay keeps them apart. System support is a five-item index: whether the courts guarantee a fair trial, respect for the country’s political institutions, whether basic rights are protected, pride in living under the political system, and whether one should support it. It measures legitimacy, how the state as it is sits with its citizens. The democracy-agreement item asks, on the same 0 to 100 scale, how far one agrees that democracy, whatever its problems, is better than any other form of government. Political tolerance asks whether people who speak badly of the Guyanese form of government should be allowed to vote, demonstrate, run for office and appear on television. None of these is a measure of approval of the incumbent government.
Both indices ended 2012 higher than they began in 2006, though democracy agreement dipped in 2009. In 2014, the last full year of the PPP/C’s long tenure, system support fell twelve points to 46.9, its lowest in the series, and tolerance of critics of the system of government fell with it. Two years later, after the 2015 change of government, system support rose to 65.2, the highest in the series (LAPOP’s later 2016/17 comparative report gives a slightly revised 65.5, with the same conclusion), and tolerance recovered part of its loss. Yet democracy agreement fell to 61.5, its lowest since 2006. On a separate multiple-choice item in the same survey, 52.0% said democracy is preferable to any other form of government, 20.7% said that under some circumstances an authoritarian government may be preferable, and 27.3% said it makes no difference whether a government is democratic or not. The last answer is not an endorsement of authoritarianism; it is indifference, which may be the more troubling finding.
Two curves with opposite slopes. The rise in legitimacy coincided with a new government; attachment to the mechanism that produced it fell at the same time. Why is the question, not the answer. The 2021 round, taken by mobile phone after the 2020 election dispute, adds a data point. Asked which system seemed best for Guyana, one that guarantees a basic income and services for all even if the authorities cannot be elected, or one in which citizens elect the authorities even if some people lack access to a basic income and services, about 65% of Guyanese respondents chose the guarantees: a weighted 64.7% among the 511 who gave a substantive answer, out of 717 who were asked the item. Guyana showed the same rounded point estimate as Jamaica and Ecuador, the highest displayed among the twenty-two countries, with confidence intervals LAPOP reports. That is a response to a specific hypothetical put to a few hundred people, not a mandate for anything. The Stabroek editorial of September 2022, not LAPOP’s questionnaire, posed the sharper version: would a PPP voter accept an unelected PNC government on those terms, or the reverse? I have argued before that Guyanese politics offers fear where it should offer choice. If the ballot has come to feel less like a choice than an ethnic census, then trading it for material guarantees may say more about what the ballot has become than about what Guyanese think of democracy. That is a hypothesis, and it is testable: carry the item, and break it by party preference and self-identified ethnicity. It is the first question a Guyanese instrument should ask.
Why is the question, not the answer.
— T.R.B.
III. The institutions: the least trusted police in the region, and a decade of fewer bribes
The police are the state Guyanese meet most often, and for most of the series they were among the institutions Guyanese trusted least. In 2014 Guyana’s mean police-trust score, about 35 on the 0 to 100 scale, was the lowest among the country samples shown in LAPOP’s comparison, as its presenters at the Georgetown Club reported. Political parties scored about three points higher by point estimate, a gap too small to call meaningful without a design-based test.
Source: LAPOP, Preliminary Analysis of the 2016 Guyana AmericasBarometer (Donoso, May 2016). Measures: trust in the National Police (B18), recoded 0 to 100; share reporting at least one bribery experience in the past 12 months (EXC battery), percent. Weighted point estimates.
Two things stand out. First, trust in the police rose 18.8 points on a hundred-point scale between 2014 and 2016, across a change of government and with no statistically significant change in reported crime. The timing invites a hypothesis: that Guyanese read the police through the government they are seen to serve. It does not prove it. New leadership, changed expectations, or a changed willingness to criticise could each have contributed. A breakdown by party preference in both the 2014 and 2016 datasets, which the reports reviewed for this essay do not provide, would show whether the rise was concentrated among supporters of the new government; it would reveal an association, not settle the cause, and it would need care, since party identification itself can shift between rounds. A Guyanese poll should publish such breakdowns as a matter of course, so that the question can at least be put with evidence.
Second, reported corruption victimisation, the share of adults reporting at least one of the bribery experiences the survey asks about, fell from 25.2% in 2006 to 13.3% in 2016, with an uptick between 2010 and 2012. It is a measure of reported experience, not of corruption as a whole. In 2016 the rate was higher among men, the better educated and the top wealth quintiles; differences in exposure to official transactions are a plausible explanation, not a demonstrated one. The series presented here ends in 2016: before commercial oil, before 2020. Whether the decline held or reversed is a question a GBJ wave should put.
IV. The economy, the streets and the exit door
In each round from 2006 through 2014, fewer than one respondent in four said Guyana’s economic situation was better than twelve months earlier. The weighted estimate rose from 15.5% in 2014 to 43.4% in the February to March 2016 survey, 2.8 times the earlier share.
Source: LAPOP, Preliminary Analysis of the 2016 Guyana AmericasBarometer (Donoso, May 2016). Measures: percent saying the national economic situation (SOCT2) and their own economic situation (IDIO2) is better than 12 months ago. Weighted point estimates from repeated cross-sections.
The 2016 reading came before a barrel of oil had been produced, and it coincided with a change of government. Personal economic assessments moved less: from 25.2% to 37.7%, a rise of 12.5 points against the national item’s 27.9. People can reasonably judge their own circumstances differently from the country’s. How much of the national reading reflected the economy and how much the new government cannot be settled from these two lines, and these are repeated cross-sections, not the same people followed over a decade. It can be tested. A GBJ instrument should carry both questions in LAPOP’s wording, so that the gap between them, by party and by region, becomes a published quantity rather than a matter of assertion.
On crime the record is steadier. From 2010 to 2016 the surveys detected no statistically significant change in self-reported victimisation: 9.0%, 8.0%, 7.4% and 7.0%. The 2016 neighbourhood-insecurity score of 33.7 was the lowest point estimate in the published 2006 to 2016 series. The share naming security as the country’s most serious problem, a separate open-ended item, ran 27.0%, 13.1%, 11.9%, 5.5%, 27.0% and 22.0% across the six rounds. Concern fluctuated while the surveys detected no significant change in victimisation over 2010 to 2016; salient incidents, severity, coverage and politics are all candidate explanations, and the series cannot choose among them. Asked to imagine calling the police after a home burglary on a typical day around noon, 29.7% of 2016 respondents expected a response within thirty minutes and 27.1% expected it to take more than three hours. Those are expectations, not measured response times.
The exit door is the series Guyana should watch most closely. The migration item asks whether the respondent intends to go live or work in another country in the next three years. In March 2015, Dr. Elizabeth Zechmeister told Stabroek News that the share saying yes in 2014 had declined from earlier rounds, in the point estimates, but remained high by regional standards; no Guyana-specific significance test was published. The latest published AmericasBarometer reading for Guyana is from 2021, where the item went to half the telephone sample; Guyana was not included in the published 2023 or 2026 rounds. A new wave can show whether intentions have changed since; whether oil has altered the outflow itself, or who returns, is a question for migration-flow data as much as for a poll.
V. What the record cannot tell us
The honest reading of a survey record beginning twenty years ago is that its last face-to-face round, fielded in February and March 2016, describes a country since transformed by oil production, political crisis, a pandemic and rapid population growth: the 2022 census counted 878,674 residents, and the Bureau of Statistics estimated 956,044 by the end of 2024. Since 2016 Guyana has had a no-confidence motion (December 2018), commercial first oil (20 December 2019), a Natural Resource Fund established by the 2019 Act and repealed and replaced by the 2021 Act, a five-month dispute between the election of 2 March 2020 and the declaration of 2 August, and the pandemic. The 2021 round caught some of this, by telephone, in a pandemic year. Guyana was not in the published 2023 or 2026 rounds.
Four gaps follow, and they are the specification for what a Guyanese instrument should add.
- The oil questions. The AmericasBarometer’s regional core was not designed to measure the governance and distribution questions raised by Guyana’s oil sector. We have not found an item on the Natural Resource Fund, the Production Sharing Agreement, local content, or whether a household has felt a dollar of the boom. If one exists in a country module, we will report it.
- The partisan and ethnic cross-tabs. Several of the series above, system support, trust in the police, economic perceptions, moved across changes of government, while others, such as crime victimisation, held steady. Party-preference and self-described ethnicity variables appear in some waves and vary by year; the published reports rarely break the trends down by either. In 2021 I wrote about the Troxler effect, the illusion Susan Fowler uses for tribalism: fix your gaze on the red dot and the blue circle around it fades to white. A national average is the red dot. It is a valid estimate, but in Guyana it can conceal differences large enough to reverse the headline, and what fades is not two tribes but the whole periphery: Indigenous Guyana, mixed Guyanese, the young, the hinterland. Subgroup results belong in the public record alongside the average so that the circle stays visible.
- The hinterland. In 2016 the inland regions formed a single sampling stratum of 242 interviews (LAPOP’s prose lists Regions 1, 7, 8, 9 and 10; its sample table labels the stratum Regions 7 to 10), and residents of Regions 7 and 8 were excluded altogether in 2006. Two hundred and forty-two pooled interviews are not 242 per region, and they do not establish precision for regional, Indigenous or intersecting subgroups. Indigenous Guyana deserves better than a wide confidence interval.
- The diaspora. The AmericasBarometer samples residents, not Guyanese abroad, and we identified no comparable series on diaspora attitudes in the sources reviewed. For scale, the World Bank puts personal remittances received at about US$546 million, or 3.2% of GDP, in 2023. The diaspora’s view of Guyanese institutions, and its intentions about return, are unmeasured.
None of this is a criticism of LAPOP. It is a description of the work left to do.
VI. What the Guyana Business Journal proposes
We propose to build a Guyanese public opinion series on the AmericasBarometer’s foundations rather than beside them. The design rests on five commitments.
Carry a LAPOP core in LAPOP’s words. A documented, repeated subset of AmericasBarometer items, carried in their wording and response scales wherever those permit comparison: the system-support battery, the democracy-agreement item, the tolerance items, trust in the police, courts, elections and parties, the two economic retrospectives, crime victimisation and neighbourhood insecurity, the bribery-experience items, and migration intention. Counted as questions that is about two dozen, which is why the block will be piloted for interview length before the first wave. Every departure from LAPOP’s wording, mode, fieldwork or coverage will be reported with the results, because identical wording makes comparison possible without guaranteeing it.
Add the Guyana module. On top of the core, a rotating module of questions tailored to Guyana’s circumstances: trust in the management of the Natural Resource Fund; whether the Production Sharing Agreement should be renegotiated; whether the respondent’s household has felt the oil economy in income, prices, or both; cost of living as the most serious problem; confidence in GECOM; attitudes to Venezuelan, Cuban and Bangladeshi migrants; and the Essequibo controversy. These are the questions our readers argue about every week with no data.
Publish the breakdowns. Headline figures will be released with their breakdown by party preference, self-identified ethnicity, region, age and education wherever sample size and respondent confidentiality permit, each with its cell size and margin. Where a cell is too small to report, we will say that too.
Publish the method before the numbers. Before fieldwork: the sampling frame, mode, question wordings, field dates, and the official adult-resident population benchmarks used for calibration, including age, sex, region and urban or rural targets. With the results: achieved sample, response rates, item-level Ns, weights and design-based margins of error. Weighting does not cure coverage error or small cells, and we will not pretend it does. LAPOP’s technical notes run to a few pages and tell you everything; ours will meet that standard. In a country where any measurement is quickly branded partisan, the first wave’s credibility will rest on whether an opponent can check the work.
Partner, do not duplicate. We intend to discuss with the Center for Global Democracy at Vanderbilt the opportunities for a future Guyana survey or supplemental study, and to approach the University of Guyana’s Institute of Development Studies, LAPOP’s original 2006 partner, as the natural academic home. Those conversations have not yet begun; both are prospective collaborators. Fieldwork, especially in the hinterland, will need a partner with demonstrated capacity on the ground. GBJ’s contribution is frequency, topicality and a readership, in Georgetown and in the diaspora, that will actually read the numbers.
The target for a first wave is the first half of 2027, subject to funding and field capacity being secured. Between now and then we will publish the baseline series in full, item by item, so that when our first numbers arrive readers will know what came before them.
Twenty years ago a team from Nashville began asking Guyanese what they thought of their country. The answers are on record. What this initiative can promise is to find out which explanations the evidence supports, and how the patterns have changed since the last reading, rather than to assume either. Five years ago, writing about the Natural Resource Fund, I asked readers to imagine the whole Guyanese tribe, all of it, embedded in the debate over our inheritance. Imagining is what we have been doing. A poll that reaches the whole country, publishes its method, and shows the circle as well as the dot is one way to stop imagining what Guyanese think and begin asking them.
That is a modest promise.
It is also the only one that will survive contact with the data.
Terrence Richard Blackman is Dean (Interim) of the School of Science and Allied Health and Professor of Mathematics at Medgar Evers College, City University of New York, and the Founder and Publisher of the Guyana Business Journal. The views expressed here are his own and do not represent the positions of Medgar Evers College or the City University of New York.
Note on Sources and Method
All 2006 to 2016 figures are LAPOP’s own published, design-weighted point estimates from the preliminary report on the 2016 Guyana survey (Juan Carlos Donoso, May 2016), with sample sizes, dates and designs from the country technical notes. The 2021 forced-choice figure is from LAPOP’s Insights report of September 2022. Guyana’s absence from the 2023 and 2026 rounds is per the published 2023 regional report and the 2026 general technical report. The charts show weighted point estimates without confidence intervals; intervals depend on each estimate and the survey design and must be calculated from the microdata, and nothing is inferred here from the visual separation of lines. We have not re-analysed the microdata. The datasets are public, and a full item-by-item series with partisan and regional breakdowns is the next instalment.
- About the AmericasBarometer, LAPOP Lab / Center for Global Democracy, Vanderbilt University
- Preliminary Analysis of LAPOP’s National Survey in Guyana, 2016 (Donoso, May 2016) and the 2016 Guyana questionnaire
- Guyana technical notes: 2006, 2009, 2010, 2016/17, 2021 technical report and 2021 questionnaire
- Who Is Willing to Trade Away Elections for Material Guarantees? LAPOP Insights, September 2022
- The Pulse of Democracy 2023 and the AmericasBarometer 2026 General Technical Report (country coverage)
- AmericasBarometer Guyana 2006 dataset and 2014 dataset, USAID / data.gov
- Stabroek News: survey findings presented at the Georgetown Club (March 2015); “Fewer Guyanese looking to migrate” (7 March 2015); “Touch and go for Election 2020” (Business Page, 19 May 2019); editorial, “LAPOP survey” (16 September 2022)
- Preliminary Report, Guyana National Population and Housing Census 2022, Bureau of Statistics
- ExxonMobil begins oil production in Guyana (20 December 2019)
- World Bank, personal remittances received (% of GDP), Guyana
With Thanks to Our Sponsors
Metallica Commodities Corporation
Sponsors support the Journal’s work and have no role in its editorial judgments.
Pebble Stream™
Sponsors support the Journal’s work and have no role in its editorial judgments.
Caribbean International Shipping Services
caribshipatl.com · 770-322-3111
Sponsors support the Journal’s work and have no role in its editorial judgments.
MCCGUSA
mccgusa.com · 212-269-6126
Sponsors support the Journal’s work and have no role in its editorial judgments.
With thanks to our individual supporters: Courtney Noel | All Te Networks | Corine Locke | Tony Harris | Roderick Alsopp | Dr. Michelle Luard | Clarence Bone
🇬🇾 Support independent Guyanese journalism: guyanabusinessjournal.com/donate/
